
Services
Three service areas covering urban planning, urban research and digital mapping. They use the same data and methods, and are organised so that each informs the others.
Service area A
Urban Planning and Development
Planning work sets out how land and settlements are organised and how they are expected to change. It combines analysis of existing conditions with proposals for land use, growth and settlement structure.
Activities
- Urban planning
- Land-use planning
- Spatial development strategies
- Urban growth assessment
- Settlement planning and analysis
Questions addressed
- How is land used now, and what does that pattern allow or prevent?
- Where is the settlement growing, and how quickly?
- Which areas could take further growth, and under what conditions?
- How should land uses, movement and open space relate to one another?
Outputs may include land-use plans, spatial strategy documents, growth assessments, settlement profiles and supporting maps.
Service area B
Urban Research and Analysis
Research and analysis provide the evidence that planning and development decisions depend on. The work covers the form, population and land use of urban areas, using field information, available datasets and GIS-based analysis.
Activities
- Urban studies and research
- GIS-based spatial analysis
- Population and demographic studies
- Urban density assessment
- Land-use analysis
- Urban development research
Questions addressed
- How dense is the built-up area, and how does density vary across it?
- How is the population distributed, and how is it changing?
- What does the land-use pattern show about how an area functions?
- What data exist, how reliable are they, and what is missing?
Outputs may include research reports, technical notes, analytical datasets, tables and charts.
Service area C
Digital Mapping and Visualisation
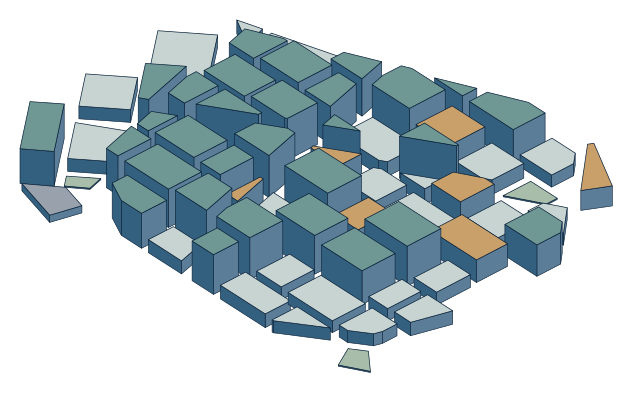
Mapping and visualisation turn spatial information into material that can be read, checked and discussed. The range runs from base and thematic maps to 2D and 3D urban models and presentation graphics.
Activities
- GIS mapping
- Thematic cartography
- Spatial data visualisation
- 2D and 3D urban modelling
- Digital maps and spatial presentation
Questions addressed
- How should this information be classified and shown so that it is read correctly?
- What scale and level of detail does the decision need?
- Which form – map, section, model or diagram – explains the issue best?
Outputs may include base maps, thematic maps, spatial datasets, 2D and 3D models and presentation material.
—How the work is organised
Each assignment follows the same sequence, whichever service area it falls under.
Define the question
Agree what needs to be known or decided, for whom, and at what level of detail.
Gather and assess data
Identify available sources, check their quality and note what is missing.
Analyse
Apply spatial and statistical methods suited to the question and the data.
Represent
Prepare maps, diagrams and models that show the results accurately.
Report
Document the method, results and limitations in a form others can review.